
No: Q-11050/52/2006-Agru
Planning Commission
(Agriculture Division)
Yojana Bhawan
Sansad Marg, New Delhi
Dated: 11th October 2007
Sansad Marg, New Delhi
Dated: 11th October 2007
OFFICE MEMORANDUM
Subject: Technical Support Group (TSG) for developing Manual of Guidelines on
Comprehensive District Agriculture Plan (C-DAP)
The undersigned is directed to convey that it is has been decided with the approval of the competent authority, to constitute a Technical Support Group (TSG) for preparation of a manual on C-DAP comprising of the following members:
1. Dr. K.B. Lavekar, Commissioner (Agriculture) Govt. of Maharashtra--------------------------------------------Chairman
2. Dr. J.P. Singh, Joint Director, Dept. of Agriculture & Cooperation--------------------------------------------- Member
3. Dr. M.N. Reddy, Director, MANAGE-------------------------------------------------------------------------------------Member
4. Dr. A.K. Padhee, Director (Agriculture) Orissa-------------------------------------------------------------------------Member
5. Mr. R. Sundar, DGM, NABARD, Bangalore------------------------------------------------------------------------------- Member
6. NGO Representative on each from PRADAN and PRIYA------------------------------------------------------------ Member
7. Dr. A.K. Dixit/ Dr. H.S. Sur, Planning Commission Representative------------------------------------------------ Member
8. Dr. Bhaskar Gaikwad, KVK Representative Ahmednagar------------------------------------------------------------- Member
9. Dr. R.S. Deshpande, Prof., Institute of Socio-Economic Change, Bangalore--------------------------------- Convenor
The TORs for TSG will be as follows:
- To examine the contents of the existing sources that would be used for C-DAP,
- To consult the stakeholders at various levels,
- To Develop Draft Manual of guidelines for C-DAP and
- To validate the guidelines in the field condition in selected districts through selected
capacity building institute(s) on regional basis
- The TSG for C-DAP may co-opt any expert/institute, if required.
- The TSG for C-DAP may conduct meetings as required at mutually agreed locations
- TA/DA for non-officials and expenditure incurred for organizing the meeting would be met by the planning commission.
S/d
(Dr. Renu S Parmar)
Director (Agriculture)
Tel: 011-23096605
Email: rsparmar[at]nic[dot]in
(Dr. Renu S Parmar)
Director (Agriculture)
Tel: 011-23096605
Email: rsparmar[at]nic[dot]in
Distribution
1. Chairman and Members/Convenor
2. PS to Secretary DAC/DARE/DAHD
3. PS to Member (AS)/Member (BNY)
4. PPS to Sr. Adviser (Agriculture)/Sr. PPS to Advisor (Agriculture)
List of Addresses of Chairman and Member/Convenor
1. Chairman and Members/Convenor
2. PS to Secretary DAC/DARE/DAHD
3. PS to Member (AS)/Member (BNY)
4. PPS to Sr. Adviser (Agriculture)/Sr. PPS to Advisor (Agriculture)
List of Addresses of Chairman and Member/Convenor
- Dr. K.B. Lavekar, Commissioner (Agriculture) Govt. of Maharashtra , Pune
- Dr. J.P. Singh, Joint Director, Dept. of Agriculture & Cooperation, Ministry of Agriculture, Government of India, Krishi Bhawan, New Delhi.
- Dr. M.N. Redddy, Director, National Institute of Agricultural Extension Management (MANAGE), Rajendranagar, Hydrabad- 500 030 A.P. India
- Dr. A.K. Padhee, Director (Agriculture) Government of Orissa, Bhubaneshwar
- Mr. R. Sundar, DGM, NABARD, C-24, G Block, Bandra Kurla Complex, Bandra (E), Mumbai – 400 051
- NGO Representative on each from PRADAN, Post Box No. 3827, 3 Community Shopping Centre, Nil Bagh New Delhi- 110049 NGO Representative on each from Society for Participatory Research in Asia (PRIYA), Tughalkabad Institutional Area, New Delhi- 110062
- Dr. A.K. Dixit/ Dr. H.S. Sur, Planning Commission Representative
- Dr. Bhaskar Gaikwad, KVK Representative Ahmednagar
- Dr. R.S. Deshpande, Prof., Institute of Socio-Economic Change, Nagarbhavi, Bangalore 560072
Composition of the Technical Support Group
1. Dr K B Lavekar, Commissioner of Agriculture, GoM, Pune,---------------------------------------Chairman
2. Dr A K Dixit, Consultant, Planning Commission, GoI,---------------------------------------------- Member
3. Dr Hardip Singh Sur, Consultant, Planning Commission, GoI------------------------------------ Member
4. Dr Arvind Padhee,IAS, Director Agriculture, GoO,-------------------------------------------------Member
5. Dr J P Singh, Joint Director, DAC, GOI----------------------------------------------------------------Member
6. Dr K R Rao, CGM, NABARD, Mumbai -------------------------------------------------------------------Member
7. Dr M N Reddy, Director, MANGE, Hyderabad -------------------------------------------------------Member
8. Dr R Sunder, DGM, NABARD, Bangalore --------------------------------------------------------------Member
9. Dr Bhaskar Gaikwad, Krishi Vigyan Kendra,Ahmednagar------------------------------------------Member
10. Dr D C Mishra, National Informatics Centre,New Delhi-------------------------------------------Member
11. Dr Manoj Rai, PRIA, Society for ParticipatoryResearch in Asia --------------------------------Member
12. Dr Manas Sathpathi, PRADAN, New Delhi-----------------------------------------------------------Member
13. Dr V V Sadamate, Advisor, Planning Commission, GoI Spl------------------------------------- Invitee
14. Dr R S Deshpande -----------------------------------------------------------------------------------------Convener
Frequently Asked Questions (FAQs)
1. How C-DAP is different from earlier Agriculture Plan?
Answer: C-DAP is an initiative taken in response to main theme of the 11th Five Year Plan. This is taken up to make a district as the planning unit, with the plan process constituted from below. This is based on the part of the Prime Minister’s address to the National Development Council on December 19, 2007. Essentially, C-DAP involves preparation of the agricultural development plan from Gram Panchayat upwards to district level. The essential focus of this exercise is to empower to grass-root institutions in the planning process and understanding the development initiatives at the grass-root.
This is different than the earlier agricultural planning exercise which broadly followed the top to down approach and began with the state level fixing of the targets which were disaggregated to the districts and down below. This involved the risk of bypassing some of the location specific initiatives as also the possibility of overlooking the differential requirements across districts.
2. Who is responsible for C-DAP - Preparation - Implementation?
Answer: Preparation of C-DAP begins from the grass-root level at Grama Panchayat. After discussions in the Grama Sabha about the development needs, priorities and the plan it goes to the Taluk Panchayat for the purpose of consultation, consolidation and refinement. Finally, it reaches the Zilla Panchayat for fine tune, aggregation and to work out the requirements as well as time dimension of the plan. The plan envisages vertical as well as horizontal integration across the departments participating in agriculture as well as allied agriculture sector development. The implementation is entirely the responsibility of the Line Departments in the purview of the prepared plan.
3. Who is responsible for preparation of Action plan of C-DAP at various levels? Who would be responsible for Agriculture Planning at GP level; IP level and ZP LEVEL?
Answer: At Grama Panchayat level Village Agricultural Planning Unit (VAPU), at Taluk Panchayat Taluk Agricultural Planning Unit (TAPU) and Mandal Agricultural Planning Unit (MAPU) and at district level it will be District Agricultural Planning Unit (DAPU) shall be responsible for preparation of the plans at various levels. These units will be supported by the designated Technical Support Institutions and Hand-holding Institutions in addition to the experts from various fields.
4. How C-DAPs would be integrated in SAP?
Answer: The C-DAP will provide the basic material for preparation of the State Agricultural Plan (SAP). But State plan shall not be only the additive of the C-DAP. The State Agricultural Plan may include additional schemes or programmes to those suggested in the District Agricultural Plans. The State Plan shall also keep in view the inter-district disparities and regional equity in the development focus.
5. In what way C-DAP would assist in increasing farmers’ income?
Answer: C-DAP shall include along with the schemes the possible incremental income and employment effects of the proposed schemes. These will be worked out under the two streams viz., the working scheme and the new innovative schemes. Essentially, during the preparation of C-DAP the incremental income and employment effects will be kept in view.
6. What will be the sources of data at different level?
Answer: The data formats and the sources are indicated in the report. Largely the data from the official sources should be used and wherever such data are not available, the planning unit at that level must make efforts to get the most authentic data as well as establish procedures for collection of such data.

7 Will the sanctity of priority given to various sectors by the DAPU be considered while sanctioning funds?
Answer: The State Agricultural Plan will be a consolidation of the District Agricultural Plan with added schemes from the State; therefore, the State Agricultural Plan has to consider the allocation of funds on priority as indicated by the districts. The State Agricultural Planning Unit will decide these priorities and after deliberations with the District authorities arrive at the optimal allocation. It is certain that priority given to the sectors by DAPU will be kept in view while allocating the funds.
8. Should C-DAP be prepared on an Annual basis?
Answer: The district plan will be initially prepared for five years coinciding with the Five Year Plan, however, the chapter on ‘Vision” will keep in view a decade of development perspective of the district. There will be monitoring on annual basis and concurrent corrections would be effected.
9. What role following would be playing?
Answer:
10. Who will be the members of Expert Team at different level?
A. District Agriculture Planning Unit (DAPU):
Agriculture Technology Management Agency (ATMA) is established in most of the states of the country and as such ATMA should support the supplement all the functions of DAPU/BAPU.
B. Block or Taluka Agricultural Planning Unit (BAPU/ TAPU)
c . Panchayat/Village Agriculture Planning Unit (PAPU/VAPU):
11. What is the role of Technical Support Institutions at various levels?
Answer: The technical support institution shall continuously interact with the DAPU, TAPU and VAPU in order to prepare an implementable plan document. This shall be technically competent document with inputs from the scientists, social scientists, development thinkers, Non-Governmental Organisations and other stakeholders. It will be the responsibility of the technical support institutions to modify and concurrently support the implementation process of C-DAP.
12. In what way C-DAP would address convergence and synergy in developmental efforts / process?
Answer: Between the schemes there should be convergence and this shall be ensured with the help of DAPu at the district level and implementation process shall be decided by the State. State Agricultural Planning Unit and the District Agricultural Planning Units shall be responsible for the convergence and synergy between the State and the district bodies. There will be a few pre-decided meetings during every year to assess the implementation and the process which will be monitored by the technical support group.
13. How C-DAP can involve SAUs & KVKs for effective linkages?
Answer: The role of State Agricultural Universities and Krishi Vigyan Kendras is quite crucial in terms of providing technical input to the Planning Units at various levels (DAPU, TAPU, VAPU). The State Agricultural Universities shall nominate relevant scientists to participate in the meetings as well as the KVKs falling in the region should participate in the meetings to provide the technical and ground level corrections for the purpose of planning.
14. How the C-DAP will be implemented?
Answer: C-DAPs will be implemented in consultation with the district authorities by the Zilla Panchayat. The Planning and Agricultural Departments of the State Government shall be the apex body to oversee the process of implementation.
15. What is the fund release mechanism of C-DAP?
Answer: The fund release mechanism for C-DAP will involve yearly allocation and release on the basis of the achievements across different sectors. The funds utilised at the district level shall be presented to a full meeting of DAPU and the next installment may be asked from the State Government.
16. In case allocation of funds does not cover the entire Plan, how will the balance fund requirements be met?
Answer: If the allocation of funds does not cover the schemes and programmes designed by the district, it will be necessary for the district to generate such funds either through PPP or with the help of increased participation in different schemes. In deserving cases, the State Government may be approached for allocation of additional funds based on the requirement of the district.
17. How to make C-DAP effective in addressing developmental issues of dis-advantaged social groups and women?
Answer: As the entire formulation process of C-DAP begins at the grass-root level and takes into account all important development issues at local level, it is naturally expected that the dis-advantaged social groups and women will be considered in the plan process. However, it will be necessary at DAPU level to address specific schemes to further the concept of `inclusive growth’ and incorporate the disadvantaged social groups and women in the main stream development of the district.
18. How C-DAP would bring in necessary close linkages with input and market agencies?
Answer: C-DAP will have specifically focused on the marketing and other economic institutions operating in the district. These institutions shall include the State-led institutions in input delivery system as well as the private institutions and NGOs operating in the district. C-DAP will take note of these linkages and design a proper policy to incorporate these institutions in the developmental perspective as well as plan process.
19. How effective is C-DAP in capturing intra-district variation?
Answer: As C-DAP will be discussed at the state level in the meeting of the representatives of DAPU and the Technical Support Institutions, care will be taken to seek the plans between various districts and reduction of regional disparity across the districts and within the district.
20. What is the M & E mechanism of C-DAP?
Answer: The Technical Support Institutions shall establish a proper procedure for monitoring and evaluation of the C-DAP report and implementation across the districts. DAPU in consultation with TSI can authorise one or more institutions to get monitoring and evaluation concurrently. This report should be discussed in the month of February every year so that corrections can be incorporated during the succeeding year.
21. What is expected from a citizen? How she/he can contribute in the process of C-DAP?
Answer: C-DAP is a Plan document stemming out of the grass-root and therefore, the role of the stakeholders, citizens and elected bodies is most crucial. The Grama Sabha and Zilla Panchayat are expected to participate fully in designing, monitoring and implementing the development initiatives provided in the C-DAP.
Answer: C-DAP is an initiative taken in response to main theme of the 11th Five Year Plan. This is taken up to make a district as the planning unit, with the plan process constituted from below. This is based on the part of the Prime Minister’s address to the National Development Council on December 19, 2007. Essentially, C-DAP involves preparation of the agricultural development plan from Gram Panchayat upwards to district level. The essential focus of this exercise is to empower to grass-root institutions in the planning process and understanding the development initiatives at the grass-root.
This is different than the earlier agricultural planning exercise which broadly followed the top to down approach and began with the state level fixing of the targets which were disaggregated to the districts and down below. This involved the risk of bypassing some of the location specific initiatives as also the possibility of overlooking the differential requirements across districts.
2. Who is responsible for C-DAP - Preparation - Implementation?
Answer: Preparation of C-DAP begins from the grass-root level at Grama Panchayat. After discussions in the Grama Sabha about the development needs, priorities and the plan it goes to the Taluk Panchayat for the purpose of consultation, consolidation and refinement. Finally, it reaches the Zilla Panchayat for fine tune, aggregation and to work out the requirements as well as time dimension of the plan. The plan envisages vertical as well as horizontal integration across the departments participating in agriculture as well as allied agriculture sector development. The implementation is entirely the responsibility of the Line Departments in the purview of the prepared plan.
3. Who is responsible for preparation of Action plan of C-DAP at various levels? Who would be responsible for Agriculture Planning at GP level; IP level and ZP LEVEL?
Answer: At Grama Panchayat level Village Agricultural Planning Unit (VAPU), at Taluk Panchayat Taluk Agricultural Planning Unit (TAPU) and Mandal Agricultural Planning Unit (MAPU) and at district level it will be District Agricultural Planning Unit (DAPU) shall be responsible for preparation of the plans at various levels. These units will be supported by the designated Technical Support Institutions and Hand-holding Institutions in addition to the experts from various fields.
4. How C-DAPs would be integrated in SAP?
Answer: The C-DAP will provide the basic material for preparation of the State Agricultural Plan (SAP). But State plan shall not be only the additive of the C-DAP. The State Agricultural Plan may include additional schemes or programmes to those suggested in the District Agricultural Plans. The State Plan shall also keep in view the inter-district disparities and regional equity in the development focus.
5. In what way C-DAP would assist in increasing farmers’ income?
Answer: C-DAP shall include along with the schemes the possible incremental income and employment effects of the proposed schemes. These will be worked out under the two streams viz., the working scheme and the new innovative schemes. Essentially, during the preparation of C-DAP the incremental income and employment effects will be kept in view.
6. What will be the sources of data at different level?
Answer: The data formats and the sources are indicated in the report. Largely the data from the official sources should be used and wherever such data are not available, the planning unit at that level must make efforts to get the most authentic data as well as establish procedures for collection of such data.
7 Will the sanctity of priority given to various sectors by the DAPU be considered while sanctioning funds?
Answer: The State Agricultural Plan will be a consolidation of the District Agricultural Plan with added schemes from the State; therefore, the State Agricultural Plan has to consider the allocation of funds on priority as indicated by the districts. The State Agricultural Planning Unit will decide these priorities and after deliberations with the District authorities arrive at the optimal allocation. It is certain that priority given to the sectors by DAPU will be kept in view while allocating the funds.
8. Should C-DAP be prepared on an Annual basis?
Answer: The district plan will be initially prepared for five years coinciding with the Five Year Plan, however, the chapter on ‘Vision” will keep in view a decade of development perspective of the district. There will be monitoring on annual basis and concurrent corrections would be effected.
9. What role following would be playing?
Answer:
- District Agriculture Officers: Shall work as the Member-Secretary of the DAPU and nodal officer for DAPU. Chairman shall be as indicated in the Manual.
- ATMA: ATMA will be a component of DAPU and the basic initiatives will be incorporated in the C-DAP.
- ZP: The DAPU shall prepare the document approved by the Zilla Panchayat and therefore, Zilla Panchayat shall be the responsible institution for implementation of DAPU.
- Agriculture Committees of DPC: Agriculture Committees of DPC shall help the DAPU in establishing formulation of the plan.
- KVK: KVK shall provide necessary technical input and development initiatives required in the district.
10. Who will be the members of Expert Team at different level?
A. District Agriculture Planning Unit (DAPU):
- President of Zilla Panchayat------------------------------------------------------------ Chairperson
- District Collector/ District Magistrate--------------------------------------------------Vice-Chairperson
- An Elected Representative nominated by ZP -------------------------------------Member
- An Expert in Planning.-------------------------------------------------------------------- Member
- District Planning Officer. ------------------------------------------------------------------Member
- District Animal Husbandry Officer. -----------------------------------------------------Member
- District Level Officers of Allied Sectors -----------------------------------------------Member
- Representatives of SHG Fed/FIGs/CIGs (2-3) --------------------------------------Member
- SAU/ KVK (2-3) … -------------------------------------------------------------------------Member
- Reputed NGO (1) … ----------------------------------------------------------------------Member
- DDM of NABARD ---------------------------------------------------------------------------Member
- Lead District Manager---------------------------------------------------------------------Member
- District Informatics Officer(NIC) -------------------------------------------------------Member
- District Agriculture officer….-------------------------------------------------------------Member Secretary
Agriculture Technology Management Agency (ATMA) is established in most of the states of the country and as such ATMA should support the supplement all the functions of DAPU/BAPU.
B. Block or Taluka Agricultural Planning Unit (BAPU/ TAPU)
- President of Taluka / Block /Mandal-------------------------------------------------- Chairperson
- Block/Taluka/Development Officer ----------------------------------------------------Convener
- An Elected Representative of Block Panchayat -----------------------------------Member
- An Expert in Planning ---------------------------------------------------------------------Member
- Block/Taluk level officers of allied disciplines.----------------------------------------Member
- District Planning Officer -------------------------------------------------------------------Member
- Representative of bank ------------------------------------------------------------------Member
- Reputed NGOs at Block/Taluk level (1) ---------------------------------------------Member
- Representatives of FIGs/SHGs/CIGs (3-4) ------------------------------------------Member
- Block Level Agriculture officer…. ------------------------------------------------------Member Secretary
c . Panchayat/Village Agriculture Planning Unit (PAPU/VAPU):
- Sarpanch / President of Gram Panchayat … -------------------------------------Chairperson
- Live Stock Supervisor…. ---------------------------------------------------------------Member
- Representatives of SHGs/FIGs/CIGs (3-4). ---------------------------------------Member
- Landless Labourers (1-2)… ------------------------------------------------------------Member
- Experts available locally (2-3)… ------------------------------------------------------Member
- Village dairy Supervior/ Secretary of dairy Cooperative ----------------------Member
- Village Secretary/Gram Sevak/ Agricultural Extension Worker-------------- Member Secretary
11. What is the role of Technical Support Institutions at various levels?
Answer: The technical support institution shall continuously interact with the DAPU, TAPU and VAPU in order to prepare an implementable plan document. This shall be technically competent document with inputs from the scientists, social scientists, development thinkers, Non-Governmental Organisations and other stakeholders. It will be the responsibility of the technical support institutions to modify and concurrently support the implementation process of C-DAP.
12. In what way C-DAP would address convergence and synergy in developmental efforts / process?
Answer: Between the schemes there should be convergence and this shall be ensured with the help of DAPu at the district level and implementation process shall be decided by the State. State Agricultural Planning Unit and the District Agricultural Planning Units shall be responsible for the convergence and synergy between the State and the district bodies. There will be a few pre-decided meetings during every year to assess the implementation and the process which will be monitored by the technical support group.
13. How C-DAP can involve SAUs & KVKs for effective linkages?
Answer: The role of State Agricultural Universities and Krishi Vigyan Kendras is quite crucial in terms of providing technical input to the Planning Units at various levels (DAPU, TAPU, VAPU). The State Agricultural Universities shall nominate relevant scientists to participate in the meetings as well as the KVKs falling in the region should participate in the meetings to provide the technical and ground level corrections for the purpose of planning.
14. How the C-DAP will be implemented?
Answer: C-DAPs will be implemented in consultation with the district authorities by the Zilla Panchayat. The Planning and Agricultural Departments of the State Government shall be the apex body to oversee the process of implementation.
15. What is the fund release mechanism of C-DAP?
Answer: The fund release mechanism for C-DAP will involve yearly allocation and release on the basis of the achievements across different sectors. The funds utilised at the district level shall be presented to a full meeting of DAPU and the next installment may be asked from the State Government.
16. In case allocation of funds does not cover the entire Plan, how will the balance fund requirements be met?
Answer: If the allocation of funds does not cover the schemes and programmes designed by the district, it will be necessary for the district to generate such funds either through PPP or with the help of increased participation in different schemes. In deserving cases, the State Government may be approached for allocation of additional funds based on the requirement of the district.
17. How to make C-DAP effective in addressing developmental issues of dis-advantaged social groups and women?
Answer: As the entire formulation process of C-DAP begins at the grass-root level and takes into account all important development issues at local level, it is naturally expected that the dis-advantaged social groups and women will be considered in the plan process. However, it will be necessary at DAPU level to address specific schemes to further the concept of `inclusive growth’ and incorporate the disadvantaged social groups and women in the main stream development of the district.
18. How C-DAP would bring in necessary close linkages with input and market agencies?
Answer: C-DAP will have specifically focused on the marketing and other economic institutions operating in the district. These institutions shall include the State-led institutions in input delivery system as well as the private institutions and NGOs operating in the district. C-DAP will take note of these linkages and design a proper policy to incorporate these institutions in the developmental perspective as well as plan process.
19. How effective is C-DAP in capturing intra-district variation?
Answer: As C-DAP will be discussed at the state level in the meeting of the representatives of DAPU and the Technical Support Institutions, care will be taken to seek the plans between various districts and reduction of regional disparity across the districts and within the district.
20. What is the M & E mechanism of C-DAP?
Answer: The Technical Support Institutions shall establish a proper procedure for monitoring and evaluation of the C-DAP report and implementation across the districts. DAPU in consultation with TSI can authorise one or more institutions to get monitoring and evaluation concurrently. This report should be discussed in the month of February every year so that corrections can be incorporated during the succeeding year.
21. What is expected from a citizen? How she/he can contribute in the process of C-DAP?
Answer: C-DAP is a Plan document stemming out of the grass-root and therefore, the role of the stakeholders, citizens and elected bodies is most crucial. The Grama Sabha and Zilla Panchayat are expected to participate fully in designing, monitoring and implementing the development initiatives provided in the C-DAP.
-
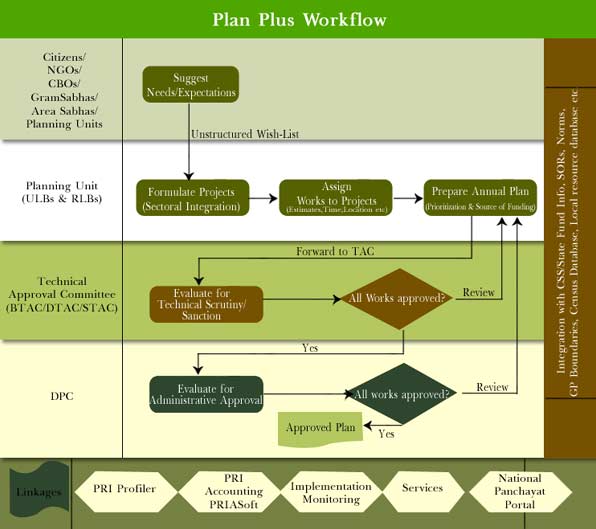
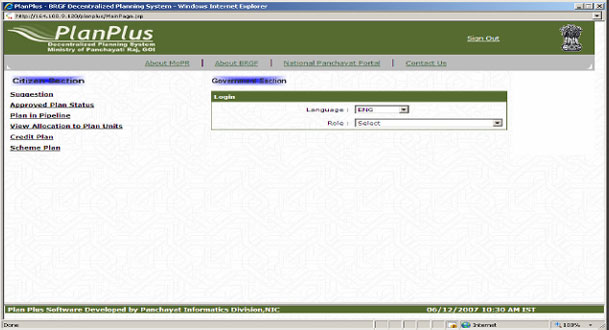
PlanPlus Software Package: To Strengthen Grass Root Planning
PlanPlus is a web based software package, supporting local language, is a ICT tool to facilitate various stakeholder in adopting decentralized Planning processes and preparation of district Plan or Sectorial plan. The package has been prepared by National informatics Centre in collaboration with Ministry of Panchayati Raj, GOI. The processes built-in in the package are broadly in harmony of the guidelines for decentralized Planning issued by the planning Commission, Government of India. The Process or work flows adopted in PlanPlus are flexible enough to suit the state specific requirements and the same has been tested at various locations including BirBhum (WB), Palakkad (Kerala), GulBarga (Karnataka) and Dhamtari (chattisgarh) districts.
- Guiding Principles: Work flows in the package attempts to promote & strengthen the processes of collaboration, Convergence & integration, Transparency in order to prepare demand-driven plan. The various stakeholders engaged in preparation of Plan for a district or sector could operate on the processes to be done by them and each stage development is shared in public domain through internet.
- PlanPlus Modules/Sections: PlanPlus software package operations are divided into
following sections
? Requirement Specification ? Captures information on Wish List, Works (location, proposed cost, proposed duration, asset/beneficiary) and Project. The stakeholder for this module are Planning Unit (Rural Local Bodies/Urban Local Bodies/Line Departments)
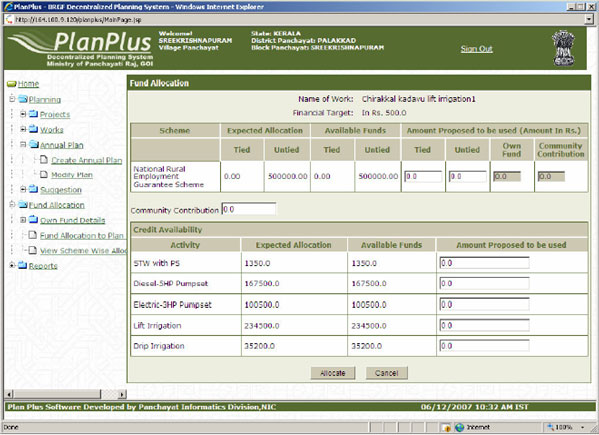
? Resource Envelope ? Captures information about resource Envelope available with Planning Unit. The stakeholder who would be providing the information for this module are State Govt. / NABARD / Banks / Planning Units
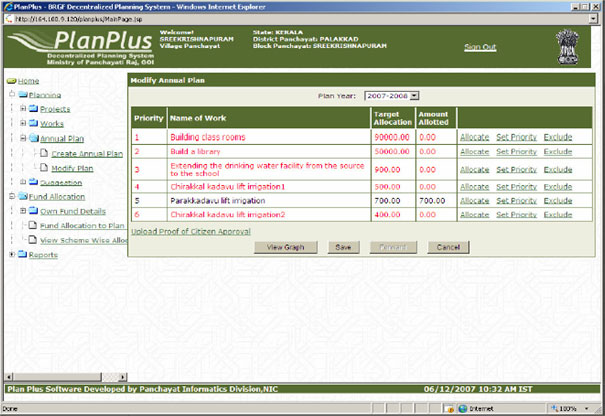
? Planning ? facilitates allocation of resources to prioritized works and captures annual plan creation,. The stakeholder for this module are Planning Unit (Rural Local Bodies/Urban Local Bodies/Line Department)
? Technical Scrutiny ? Captures the process of scrutinizing plans submitted by planning unit and offer comments on cost, duration and methodology. The stakeholders for this module are Technical Approval Committees.
? Administrative Approval ? Captures the process of according/endorsing the plans cleared by TAC and integrate it with District Annual Plan. The stakeholders for this module are District Planning Committees.
? Reports - This section provides the various reports including district preparation of district/sector level draft plan. The package uses rich graphics tools to strengthen analysis with pictorial presentation of various physical and financial data.
- Features: PlanPlus software for decentralized planning facilitates
district/sectorial plan generation in local language through interactive workflow
among various stakeholders. The Key features of the software are
? Convergence of Funds - PlanPlus enables intelligent convergence of funds from different schemes for a work, there by ensuring on the one hand that the available funds are utilized to the maximum possible extent and on the other hand that important works are not abandoned for lack of funds.
? Sectoral Integration ? PlanPlus enables sectoral integration by stimulating the planner to think in terms of end-to-end projects rather than in terms of isolated islands of work.
? Vertical & Horizontal Integration - PlanPlus provides facility for co-opting of works of a lower tier by a higher tier panchayat thereby facilitating vertical integration. It also incorporates the concept of supra-projects which enables two or more local bodies (rural as well as urban) to collaborate to take up a work which is of common interest.
? Workflow - Captures the workflow of Plan creation-evaluation-modificationfinalization.
? Plan Generation - The software generates various views of the Plan including sectoral Plan view and Scheme wise Plan besides the normal Plan view.
? Graphical and GIS reports - A number of graphical reports are generated to help the Planner as well as the District Planning Committee to take a view of the investment profile of the Plan. This would help in ensuring that the Plan is not unjustifiably skewed in favour of a particular sector.
? Adaptability to the variations across states - In view of the varying levels of capacities and experiences of different states in the Planning process, the software is being made to be easily adaptable so that states can configure it to suit their own level.
? Local Language - The software supports local languages of the states to enable local bodies to function in their own languages.
? Transparency - At every stage of the Planning process, the Plan is constantly available to the general public for scrutiny thus enabling a transparent and participative Plan preparation.
? Availability ? The software is web based and is available on 24*7 basis with proper login authentication.
- Accessibility: The Planning Commission is making arrangements with NIC and
MoPR to make the access to package available to all C-DAP districts and associated
stakeholders. The stakeholders could have training on utilization of the package
and access details from NIC-District Centre Officials when ready to commence
utilization of the same.
 List of Maps to be Included in the C-DAP
- Map of the District location in the State
- Map of the District with talukas classified in to three broad categories by development (growth) status. High Growth Talukas, Medium Growth Talukas and Slow Growth Talukas
- Map of the district showing Panchayats with the categorization as High Growth Panchayats, Medium Panchayats and Slow Growth Panchayats
- Maps showing resources position of the district up to Panchayat
a. Rainfall and Agro-climatic Regions
b. Soil Fertility
c. Irrigated and rainfed regions
d. Forest
e. Delineated watershed
f. Livestock Density by types
g. Groundwater Resources: Dark, Gray and White regions
- 5. Map showing the Crop regions of the district by area and productivity classes
- 6. Maps of Problematic regions up to Panchayats
a. Soil Salinity and other soil Problems
b. Water Logged areas
c. Drought / Flood prone regions
- 7. Maps showing availability of infrastructure up to Panchayats
a. Road Density
b. Market Density
c. Percent of Houses electrified
d. Schools and PHCs
- 8. Map showing the density of allocation of resources
- 9. Map showing location of innovative schemes
Map showing sector wise Problematic regions

 Type of Data /Information to be Collected and Analysed at Various Levels
- Collection of Data/information-
- Panchayat Level.
The types of primary data to be collected and analysed are given in the village format furnished in Annexure VI (A).
- Taluk/District Level Data Requirement
The type of secondary data to be collected and analysed at Taluk or district level are given in Annexure VI (B).
1. Basic Data
-
• General Information – (Table- 1)
2. Land
-
• Land Utilisation data (Table- 2)
-
• Land Capability Classification (Table –3)
-
• Land Holding Pattern (Table- 4)
3. Soils
-
• Soil Fertility/ Nutrition Status (Tables- 5 & 6)
-
• Problem Soils- Salinity/ Alkalinity affected Soils (Table- 7)
4. Weather/ Moisture/ Water
-
• Weather Data (Table- 8 & 9)
-
• Sources of Irrigation (Table- 10)
-
• Water analysis report (Table-11)
5. Occurrence of Natural Calamities and Safety Nets available (Table- 12)
6. Crop cultivation
-
• Infrastructure/ Support Service available and planned
-
a. Information regarding Seed and Planting Material Production
facilities and their performance (Tables- 13,14& 15
b. Soil Testing facilities - (Table- 16) o Agri- Polyclinics (Table- 17)
c. Training facilities for farmers and staff (Tables18,19&20)
d. Service Centres - (Table- 21)
e. Basic Marketing Infrastructure (Table- 22)
f. Farm level Storage available (Table- 23)
-
• Season- wise Area, Production and Productivity of all Crops (Tables- 24,25, 26,
27&28)
-
• Input use and planning
-
a. Seed Replacement Rates (Table- 29 – district level)
b. NPK Consumption and planning (Table- 30 & 31)
c. Use of Plant Protection measures(Table-32)
d. Use of modern Tools/ Equipment/ Mechanisation (Table 33 & 34)
e. Micro irrigation and protective irrigation plan (Table 35 & 36)
f. Credit and insurance facilities available and use from different sources (table 37, 38, 39 &40)
-
• Watershed Activities
-
a. Covering soil survey programmes (Table – 41)
b. Area available for watershed development and plan (Table –42)
c. Technologies for in situ conservation plan (Table – 43)
-
• Proposed plan for plan
-
a. Soil testing programme (Table-44)
b. Organic input production (Table-45)
c. IPM demonstration (Table – 46)
d. INM demonstrations (Table – 47)
e. Varietal demonstration (Table –48)
f. Farmers’ Field schools (Table-49)
g. Tools utilized for improving crop production (Table- 50)
h. Crop diversification plan (Table-51)
i. Additional area to be brought under organic farming (Table – 52)
j. Area expansion plan –horticulture (Table-53)
k. Rejuvenation plan for horticulture crops (Table-54)
-
7. Sericulture
-
• Sericulture information (Table – 55)
• Proposed physical and Financial targets for sericulture (Table –56)
-
8. Live Stock information
-
• Live Stock Census data (Table- 57)
• Veterinary support facilities available (Table- 58)
• Infrastructure, Milk Chilling etc and markets for Livestock
• Production and Yield levels (Table – 59)
• Proposed physical and financial programme of AH Dept including dairy. (Table –60)
-
9. Fisheries
-
• Resources information (Table 61)
• Source wise water spread area in the district (Table – 62)
• Projections for fish production, seed to be stocked and hatchery required for plan (Table – 63)
• Financial targets and achievements during X plan for fisheries development (Table-64)
• Projected outlay for plan ( Table-65)
-
10. Agro processing
-
• Agro processing centres in the district (Table-66)
• Marketing infrastructure plan ( Table-67)
• Milk processing
-
11. Social Forestry
-
• Action plan for social forestry (Table – 68)
-
12. Small Scale Industry
-
• Product wise no. of SSI units in the district (table-69)
• Action plan for KVI programmes (Table-70)
• Progress of DIC during X plan (Table-71)
• Action plan for DIC during plan(Table-72)
-
13. Handloom Sector
-
• Financial achievements during X plan for handloom (Table –73)
• Details of the proposed industries under handloom &Textiles (Table-74)
-
14. Group Organisations in the District
-
• Farmers clubs, SHGs, Krishi Vigyan Mandals, Community groups (table-75)
-
15. Achievements of Schemes
-
• Achievements under district sector schemes (Table-76)
• Achievements under state sector schemes (Table-77)
-
16. Physical and Financial Programme under CDAP during plan
- Panchayat Level.
- Analysis of Data/ Information and Outcome Planning
The basic approach envisaged is to look at the resource endowments of the district, assessing the present levels of utilization of resources, production, productivity, sustainability, etc., and drawing up a SWOT Analysis for the district. The plans drawn up would be essentially to capitalize on the strengths and opportunities, treats the weaknesses and threats as challenges to overcome. The driving consideration in this entire exercise would be planning for ‘outcomes’- the desired state of affairs, as compared to the traditional method of planning outlays. Some of possible outcome planning possibilities are listed below:
- Land Utilisation patterns in conjunction with ownership information could be used
effectively for planning for providing common facilities.
- • Appropriate legal/ legislative measures could be considered to facilitate
leasing/ other arrangements to facilitate public- private partnerships for
delivering common facilities, use of unused public resources, etc.
- Appropriate use of land according to capability classification to be kept in view for sustainable development
- Completion of surface water irrigation projects and planning for optimal
exploitation of groundwater resources to be given thrust for increasing cropping
intensity
- • Interventions to increase Irrigation/ Water Use efficiency for crops
•Desiltation of ponds, tanks, water bodies, etc.
- Land Utilisation patterns in conjunction with ownership information could be used
effectively for planning for providing common facilities.
- Yield Gaps for all important crops to be assessed and interventions planned to
reduce such Gaps
- • The reasons for the Yield Gaps and the interventions required are to be
planned using participatory/ consultative processes, involving all
concerned stakeholders
- While the interventions to reduce the Yield Gaps will be based on the felt needs
of the farming community, these interventions could include
- • Soil Testing campaigns/ projects
• Soil conservation and in- situ moisture conservation interventions
• Need- based use of manures, fertilizers and other inputs
• Interventions in production and supply of quality seeds
• Farm implements/ equipment and machinery for farm efficiency
• Extension/ Training/ Demonstration support
- Interventions for post- Harvest support, marketing arrangements
- • These should take into account the existing storage and market
infrastructure, their sufficiency and come out with the plans to make
good the deficiencies
- Alternate land use, crop diversification, etc., could be planned based on technical and market considerations
- A cogent plan may be prepared for the animal husbandry, dairying and fisheries
sectors taking into consideration the high growth rates of these sectors. These
plans could take into consideration, the following aspects:
- •The present position of the sector, the potential for growth and the
impediments in the way of achieving such growth rates.
• The plans prepared for these sectors would be by way of interventions that need to be made to remove the impediments identified.
• The impediments could be inputs supply, marketing, training/ extension support, etc. - A major thrust of the planning exercise would be in the area of Public- Private Partnerships to provide the required inputs and services.

- Contents of Proforma for Gram Panchayat Plan
1. Socio-Economic background of the population in GP 1.1 Socio-economic background of the households in each village in GP 1.2 Poverty status of the households by social groups 1.3 Literacy rates by sex and caste groups in each village in GP 2. Agricultural Sector 2.1 Land use particulars for latest year 2.2 Sources of irrigation for latest year 2.3 Performance of tanks in the GP 2.4 Conditions of irrigation wells 2.5 Area under crops including horticulture 2.6 Average yield of major crops in the village 2.7 Area suffering from low yields, reasons and solutions in the GP 2.8 Lands having problems like water logging, soil erosion, etc. and possibilities of its use 2.9 Application of chemical fertilisers for different crops 2.10 Problems in procuring agricultural inputs and solutions 2.11 Sources of draft power 2.12 Other problems in agriculture and solutions 3. Animal husbandry, dairy and Fisheries 3.1 Livestock population by species and quality 3.2 Milk yield per day by species and quality 3.3 Marketing of milk 3.4 Availability of fodder and water for animals 3.5 Constraints for increasing milk production in the village 3.6 Poultry and fishing activities in the village 3.7 Potential livestock activities and the support needed 4. Accessibility of Socio-economic facilities 5. Education 5.1 Primary school enrollment in each village in the GP 5.2 Infrastructure available and additionally needed in primary schools 5.3 Infrastructure available and additionally needed in government or aided high schools 5.4 Infrastructure available and additionally needed in government or aided junior college 6. Housing, drinking water, sanitation, roads and electricity 6.1 Houses by type of roof in each village in the GP 6.2 Total number of houseless population 6.3 Houses constructed under IAY during the previous year 6.4 Sources of drinking water and water borne diseases in the village 6.5 Problems with the available sources of drinking water 6.6 The availability of public latrines and the additional needs 6.7 Maintenance of public latrines 6.8 Improvements to roads needed 6.9 Electricity connections, power supply and households without power supply 7. Self Help Groups 7.1 Particulars of self help groups 7.2 Details of inactive groups and interventions needed , if any 7.3 Economic activities taken up by the SHGs 7.4 Participation of SHGs in government schemes 8. Small Scale and Cottage Industries 9. Working of NREGS and other poverty alleviation programmes in the GP 9.1 GP perspective plan under NREGS 9.2 Implementation of NREGS during last year 9.3 Employment outcomes of the NTRGS during 2006-07 9.4 Lean seasons for of wage labour and employment needed in each period 9.5 Problems faced by beneficiaries of other poverty alleviation programs 10. Important felt needs in each village in the Gram Panchayat 11. Financial resources of the Gram Panchayat 11.1 Demand and collection of various taxes in the Gram Panchayat 11.2 Outside funds spent in the GP 11.3 Outside funds spent in the GP 12. Schemes identified to be included in the GP plan with a division into GP
Plan Schemes and Block level schemes
- Proforma for Primary Data Collection at Village/GP Level
State: District: Block: Gram Panchayat: GP Code (If any):
- Socio-Economic and Demographic Information (Village-wise)
- • Social and Economic profile of households
Sr. No. of Village Village 1 Village 2 Village 3 Village 3 GP total Name of village Distance from GP(km) Population : Male : Female : Total Total households SC households ST households BC households Other households Landless labour households Total Cultivator households (Of which) Sub-marginal* Marginal * Small* Medium* Large* Tenant* Business Service **Artisans
1.2. 3.
Note: a)*Sub-marginal : Less than 2.5 acres, b) Marginal farmer: 1.0-2.5 acres, c) Small farmer: 2.5-5.0 acres, d) Medium farmers 5-10 acres, e) Large farmers : above 10 acres, f) ** Artisans include blacksmiths, carpenters, masons, weavers
- • Poverty Status of Households
Social Category Poorest of
the PoorPoor Non-
PoorTotal Ration
Cards issuedAnnapurna
Cards issuedOld age
pensionsSC ST BC OC Total
- • Literacy Rates by Social Groups-200
Village SC ST All Male Female All Male Female All Male Female All 1 2 3 4 GP
- Agriculture
-
• Land Use Particulars for Latest Year
Type of Use Area (ha) Forest Cultivable Waste Land Put to non-agriculture uses Permanent fallows Other fallows Net area sown Area sown more than once Gross cropped area Geographical area
- • Sources of Irrigation for Latest Year (ha)
Source No. of items Net area irrigated Area irrigated
more than onceGross area
irrigatedCanal Tank (Pub) Tank (Pvt) Open well Bore well Lift Irrigation
- • Performance of Tanks Used Wholly or Partly For Irrigation
Sr.
No.Public or
PrivatePurpose* Command Area (ha) If ayacut
declined, reasonImprovements
needed1. 2. 3. 4. 5. 6.
Note: * Purpose codes : Only irrigation 1, Irrigation & Fishing :2; Irrigation, Fishing & Water for animals 3; Irrigation and water for animals
- • Conditions of Irrigation Wells by Type
Item Private open
wellsCommunity
borewellsCommunity
borewellsPrivate
borewellsTotal Number of wells No. of non-functioning
wellsReason of failure:
12 3 4 Interventions needed 1 2 3 4 Problems with functioning
wells1 2 3 4 Interventions needed 1 2 3
- • Area Under Food and Horticulture Crops (ha)
Crop* Kharif Rabi Summer Annual Crop Irrigated Rainfed Irrigated Rainfed Irrigated Rainfed Irrigated Rainfed
* Follow the order : cereals, pulses, other crops, vegetables, fruits and fodder crops
- • Average Yield of Major Crops in the Village:
Crop* Kharif Rabi Summer Irrigated Rainfed Irrigated Rainfed Irrigated Rainfed * Follow the order: cereals, pulses, other crops, vegetables, fruits and fodder crops
- • Area Suffering From Low Yields Compared to Average Yield in the GP
Area (ha) Reason Reason Remedial measures
-
• Public and Private Lands under Problems in the GP (presently not
under cultivation)
Sr. No. Problem* Extent (acres) Improvements needed Benefit per acre (Rs.) If not suitable for agriculture, alternative use *Problems like water logging, leveling, soil erosion, salinity, etc. are to be identified
-
• Use of Fertiliser and Manure for Important Crops (kg/ha)
Crop Name of Fertiliser Kharif Rabi Summer Irrigated Rainfed Irrigated Rainfed Irrigated Rainfed 1 1 2 2 1 2 3 1 2 4 1 2 5 1 2
-
• Problems of Availability of Agricultural Inputs: Seeds
Crop* Seed
varietySeed rate
(Kg/acre)Total
seed
neededSupplied by
govt. last
yearProblems in
procuring seed*Collect only for crops facing problems in procuring seed
-
• Problems in Procuring Pesticides
Crop Name of
pesticideQuantity required
(kg/lit per ha)Quantity required
(kg/lit per ha)
-
• Source of Draft Power for Cultivation
Source Level of dependence Fully Partly Not at all Animal Tractor Are hire services of bullocks /tractors available in each village? Yes/No
If no, mention the villages where not available: 1. 2. 3.
•Any Other Problems in Agriculture Sector and Your Suggestions for Solving Them
Natural Calamities/DisasterProblem Suggestions
- Livestock
-
• Livestock Population
Type of animals Number of animals Cattle local/ND CB/Graded Total Buffalo Sheep Goat pigs poultry others No. of households - Livelihood system
- Crop/livestock system
-
• Carcass yield of Meat Animals
Type of Animal Average Live weight of
mature animals (Kg.)Average carcass
weight (Kg.)Sheep Goat Pig Others
-
• Milk Yield by Type of Animals
Type of animals Milk Yield (litres/day) Graded buffalo Local buffalo Cross bred cow Local cow
-
•Quantity of Milk Marketed (litres) by Agency on Each Day in Peak, Flush and LeanSeasons
Village /Season Milk collection centres Private vendors Private cooperative Others 1 2 3 4
-
• Number of Households depending on livestock
Village Type of
AnimalNo. of
animalsBreed Milk yield Problems if
any
• Availability of fodder from common lands
- a) Extent of common land available for grazing (acres) :
- b) Do you find scarcity of grazing land? Yes/No
- c) If yes, nature of scarcity:
- i) Nine months ii) Six month iii) Less than six months
- d) Availability of crop residues & cultivated fodders
-
• Sources of water for animals
- a) Mention the sources of water for animals
- i) ii) iii)
- b) Is water adequate? Yes/No
- c) If no, suggest the method of solving the problem
-
• Constraints for increasing milk production in the villages of GP?
- a) Low quality animals because work animal is the first priority ( )
- b) Greed fodder problem ( )
- c) Problem in marketing of milk ( )
- d) Low price of milk ( )
- e) Low priority for dairying as compared to other livestock activities ( )
- f) Any other (specify) ( )
-
• Poultry
Type of poultry No. of Households No. of birds Services needed Commercial Improved Local/Desi Sheep/goat/piggery
-
• Number of Households Depending on Fishing
Village Variet y Sources of fishing No. of households/ dependent Problem, if any Possible Solution
-
• Potential Livestock Activities to help the Poor and the Support Services Needed
Village Activity* Households to be covered Support services needed *Activities : 1. dairy with CBC, 2. dairy with GB, 3. dairy with local buffalo
4. goat 5. sheep 6. backyard poultry
- Potential Livestock Activities to help the Poor and the Support Services Needed
Function Exists or not* If not, distance from GP in KM (0.0) Remarks Primary School Middle School High School Junior College Degree College Technical Education Private Convent Adult Education Centre Trained Dhai ANM Centre P.H. sub-centre P.H.C. Private RMP Family Planning Centre Private MBBS Private Clinic Private Hospital Medical Stores Livestock Unit AI Centre Veterinary sub-centre Veterinary Centre Weekly market Ration shop Daily Market Regulated Market Dairy Cooperative Society Primary Veterinary Clinics Agricultural inputs shop Commercial bank Primary Coop. Society Milk Collection Centre Branch Post Office Sub post -office Telgraph office Telephone facility Bus stop Railway station Petrol pump Cinema Police Station Cold storage Rice & flour mill Oil expeller Repairs of agric. implements * Code for existence: Exists -1 Does not exist - 2
- Education
-
• Particulars of Enrollment in Primary/Upper Primary School
Item Village 1 Village 2 Village 3 Village 4 Is primary school available in the village Yes/No Yes/No Yes/No Yes/No No. of Boys enrolled No. of girls enrolled Average attendance per day of boys Average attendance per day of girls No. of Boys enrolled in Class I No. of girls enrolled in Class I No. of boys enrolled in Class V No. of girls enrolled in Class V No. of Boys who completed Class V last year No. of Girls who completed class V last year No. of Boys who joined class VI last year No. of girls who joined class VI last year Approx. out of school boys in 6-14 age* : All Approx. out of school girls in 6-14 age* : All Approx. out of school boys in 6-14 age* : SC Approx. out of school girls in 6-14 age* : SC Approx. out of school boys in 6-14 age* : ST Approx. out of school boys in 6-14 age* : ST *Estimate provided by teachers
-
• Infrastructure Available and Additionally Needed in Primary /Upper
Primary Schools
Item Village 1 Village 2 Village 3 Village 4 Name of the village No. of Teachers (sanctioned posts) No. of teachers posted Additional teachers needed as per norms No. of class rooms Plinth area available (sft.) Additional accommodation needed (sft.) Plinth area presently available (sft.) Plinth area additionally needed (square meters) Furniture needed in order of priority 1: 2: 3: 4: Furniture ne76eding repairs 1: 2: 3: 4: Whether toilets are available for girls Whether toilets are available for girls
-
• Infrastructure Available and Additionally Needed in Govt. or Aided High
School
Item Village 1 Village 2 Village 3 Village 4 Name of the village Enrollment No. of Teachers (sanctioned posts) No. of teachers presently working Additional teachers needed as per norms Plinth area presently available (square metres) Plinth area additionally needed (squre metres) Furniture needed in order of priority
1:2: 3: 4: Furniture needing repairs
1:2: 3: 4: Whether drinking water facilities are available Whether toilets are available for girls
-
• Infrastructure Available and Additionally Needed in Junior Colleges:
Sr. No. No. of Colleges Facilities available Additional facilities required 1 2 3
- Housing, Drinking Water, Sanitation, Road network and Electrification
-
• Houses in the village classified by type of roof
Village RCC Tiled Stones Thatched Total 1 2 3 4
-
• Housing Conditions and Needs for the Entire GP
Type of House SC ST Others Pucca house Semi-pucca house Kutcha house Houseless Total Houses constructed under IAY during last three years
-
• Adequacy of Drinking Water Facilities in the Villages of the Gram Panchayat
Source of Water Access Households having the facility* Gram Panchayat Village 1 Village 2 Village 3 Village 4 SC/ST Others SC/ST Others SC/ST Others SC/ST Others SC/ST Tap Within Outside Hand Pump Within Outside Open Well Within Outside Others X * Total must tally with the total number of households in the village
-
• Problems with Public Sources of Drinking Water in the Gram Panchayat
Village Source Total No. Defunct Repairs needed Additional needed 1 Handpump Open well Tap 2 Handpump Open well Tap 3 Handpump Open well Tap 4 Handpump Open well Tap i) Is the village subjected to water-borne diseases? Yes/No
ii) If yeas, specify ___________________________________
-
• Number of Households with Latrine Facility inside the House
Type Village 1 Village 2 Village 3 Village 4
-
• Number of Households Depending on Public Latrines
Type Village 1 Village 2 Village 3 Village 4 i) If additional latrines are needed, give number:
Village 1: Village 2: Village 3: Village 4:
-
• If Not Maintained Properly, Explain the Problems and Solutions
Village Problems Solutions
-
• Improvements Needed
Village Type* Existing quality Proposed quality Length (km) Cost estimate *Type : internal 1; approach 2; Connecting another GP 3
-
• Details of Electricity Connections and Supply
Village Agriculture Domestic Commercial Supply to Agriculture Houses not
connectedHours/Day Quality *Quality : Very poor, poor, moderate, good
- Self Help Groups
-
• Particulars of Self Help Groups in GP villages
Village Social Group No. of Groups Members in groups Members in active groups Total saving (Rs.) 1 SC ST Others 2 SC ST Others 3 SC ST Others 4 SC ST Others
• Details of inactive SHGs
Reasons for becoming inactive
- a)
- b)
- c)
- Interventions needed for making active
- a)
- b)
- c)
-
• Economic Activities Taken up by the SHGs
Village Activity No. of groups If difficulties are encountered, specify Assistance needed,
if any
-
• If Any Government Schemes Are Implemented by SHGs during Last Five Years, Give Details
Scheme Year No. of Groups involved Problems faced Suggestions for
rectification
- Rural Industries
-
• Cottage and Small Scale Industries in the Gram Panchayat
Type* Line of
manufactureUnits Employment Raw Material Local Outside GP *Household 1 Establishment (with hired labour) 2
• which are the small scale industries that have a potential in the GP?
- 1.
- 2.
- 3.
- Implementation of NREGS
-
• Projects Identified in the NREGP Perspective Plan
Project Estimated cost Employment Priority* * High 1 Medium 2 Low 3
-
• Other Details about NREGP
- 1. Job card issued
- 2. No. of card holders who participated last year
- 3. No. of new cards to be issued
-
4. Works completed last year: 1 2 3
- 5. Expenditure incurred last year: 1 2 3
- 6. Employment generated (person days): Male Female
-
• Lean Season for Employment and Approximate Number of Workers
Available:
Village From To From To Total Days
-
• Other Poverty Alleviation Programmes Being Implemented in the GP
Programme Scheme Beneficiaries Cost per unit Problems faced if any8282
- Mention Four Most Important Needs of the Village
Village Need 1 Need 2 Need 3 Need 4
- Financial Resources of the GP
-
• Tax Demand and Collection during Last Year
Tax Demand Collection Dues in the
yearOld dues Total dues
-
• Other Actual and Potential Sources of Income
Item Revenue collected last year Dues Potential revenue
-
• External Funding in the GP
Sr. No. Scheme/Source 2004-05 2005-06 2006-07
- Other Actual and Potential Sources of Income
Scheme Year in which to be taken up* Benefits ** Approximate
cost* Year to be noted as 1 or 2 or 3 or 4 or 5
** Only this GP 1; Spills over 2

- Formats for Collection of Secondary Data at Taluka/District Level
- Table 1: General information
General Population (As per the 2001 Census) Taluk/Block Villages No. of
Revenue
VillagesArea (ha.) No. of G.
Ps.Male Female Total S.C. S.T. In
habitatedUn-in
habitatedSource:
- Table 2: Land Utilisation Statistics (preceding 3 years average) (Area in hectares)
Taluk Geogr
aphical
areaForest
AreaLand
Under
Nonagril.
UseCultivable
wastePermanent
pasturesLand under
miscella
neous
tree crops
and grovesCurrent
FallowsOther
FallowsNet
sown
areaGross
cropped
areaCropping
intensity
(%)1 2 3 4 5 6 7 8 9 10 11 12 Source:
- Table 3 : Land Capability Classification
(Area in hectares)
Taluk Very
good
cultiv
able
land
Class
- IGood
cultivab
le land
Class-
IIModera
tely
good
cultivab
le land
Class-
IIIFairly
good
land,
suited
for
occasio
nal
cultivati
on
Class-
IVNearly level
land not
suitable for
cultivation
because of
stoniness,
wetness,
etc.
Class- VSteep
slopes,
highly
erosion
prone
with
shallow
soils
Class- VISteep slope with sever soil erosion resulting in eroded stony and
rough soil surfaces with shallow soil depth
Class- VII1 2 3 4 5 6 7 8
- Table 4: Land Holdings (Agriculture Census 2001) (Holdings in numbers and area in ha)
Taluk Marginal Farmers Small Farmers Semi-med. Farmers Medium farmers Large farmers Total No. Area No. Area No. Area No. Area No. Area No. Area Table G. ha –marginal farmers, 1-2 ha- small farmers, 2-4- ha semi-med. Farmers, 4-10 ha- medium farmers and more than 10 halarge farmers)
Source:
- Table 5 : Soil Fertility Indices (Latest data)
Sl.
No.Taluka No of Soil
Samples
analysedPH EC (ds/m) Organic carbon (%) Acidic Neutral Alkaline Low Medium High Low Medium High
Available Nitrogen (kg/ha) Available Phosparus (kg/ha) Available Potash (kg/ha) Low Medium High Low Medium High Low Medium High Source:
- Table 6: Micronutrient Status (For latest year)
Name of the Taluka No of Soil
Samples
AnalysedCopper (Cu) Iron (Fe) Manganese (Mn) Zinc (Zn) Sufficient Deficient Sufficient Deficient Sufficient Deficient Sufficient Deficient 1 2 3 N Total Source:
- Table 7: Reclamation and Development of Saline / Alkali soils (Latest data)
Taluka Area under Saline/Alkali Soil Area treated (ha)
up to 2006-7Balance Area (ha)
- Table 8: Data on Weather (Available normals)
Sr. No. Name of Taluk Rainfall Temperature Humidity (%) No. of rainy days Average rainfall (mm) Min. 0C Max. 0C Min Max Source:
- Table 9 : Block/Taluka wise monthly rainfall data (Latest data)
Sr.
No.Block/Taluka Jan Feb Mar Apr May June July Aug Sept Oct Nov Dec
- Table 10: Source wise Area Irrigated (Latest data) (Area in hectares)
Taluk Canals
(Area)Tanks Open Wells Tube/Bore
wellsLift
IrrigationOther
SourcesTotal Nos. Area Nos. Area Nos. Area Nos. Area Nos. Area Nos. Area Source:
- Table 11: Water Analysis Report (Latest data)
Name of the
TalukaNo of Water samples
analyzedPermissible C – 1 Moderately Safe
C – 2Moderately unsafe C – 3 Unsafe C – 4 Source:
- Table 12: Information on Natural Calamities
Name of
TalukaOccurrence of
CalamitiesYear in which effected
(since last 10 yrs.)Severity
M / S / VS% Cropped
area affectedLivestock mortality
(No. of animals )% of farm families
affected1 Drought Flood Cyclone Earthquake Heavy rains Pest/disease outbreak Source:
M - Mild S - Severe VS - Very Severe
- Table 13 : Infrastructure Available on Taluka Seed Farm / Trial cum Demonstration Farm
Name of the TSF /
TCDTotal area
(ha)Cultivable
area (ha)Irrigated
area (ha)Infrastructure available Animals
(Nos)Implements
(Nos)Farm Pond
/ well / lift ,
pump
(Nos)Seed
Processing
plant (Nos)Godown
capacity
(tonnes)Temporary
Shed
Average sq.
ft.Other Source:
- Table 14: Seed Production at TSF / TCD
Name of the TSF / TCD Total area
(ha)Cultivable
area (ha)Irrigated
area (ha)Crop Seed production during 2006-07 (qtls)
Proposed of Seed Production (q) 2007-08 2008-09 2009-10 2010-11 2011-12 Source:
- Table 15: Planting Material Production Plan (Area in ha, production of plants grafts in numbers)
Existing facilities
( 2006-07)2007-08 No. of
NurseriesArea
under
mother
plantsProduction
of
seedlings /
graftsNo. of
nurseriesArea
under
mother
plantsProduction
of
seedlings /
graftsInvestment
for
development
2008-09 2009-10 No. of
NurseriesArea
under
mother
plantsProduction
of
seedlings /
graftsInvestment
for
developmentNo. of
nurseriesArea
under
mother
plantsProduction
of
seedlings /
graftsInvestment
for
development
2010-11 2011-12 No. of
NurseriesArea
under
mother
plantsProduction
of
seedlings /
graftsInvestment
for
developmentNo. of
nurseriesArea
under
mother
plantsProduction
of
seedlings /
graftsInvestment
for
development
2011-12 No. of
nurseriesArea
under
mother
plantsProduction
of
seedlings /
graftsInvestment
for
developmentSource:
- Table 16: Soil Testing Laboratories in District (Latest date)
Soil Testing Laboratories Under No of Soil Testing Laboratories Annual Analysing Capacity No. of Samples Analysed No of Soil Testing Laboratories having Annual Analysing System Static Mobile Total Govt. Sector Co-operative & Public U-taking Private Sector Total Source:
- Table 17 : Facilities Available in Agri Polyclinics
Taluk Name of Agri polyclinic
Facility available (Yes or No) Farmers
TrainingDemon
strationDiagnosis
of Soil &
Water
SamplesDiagnosis
of Pest &
DiseasesProduction
of Vermi
compostGreen
HouseDormitory
facilityLibrary Museum
(crop /
implement)Computer
with
modem
Average No. of farmers benefited/ year Average Receipts/ year (Rs) Source:
- Table 18: Training Infrastructure Proposed for Capacity Building of Agriculture and Allied Department Staff
Sr No. Name
of TalukName
of the
Depart
mentName of
Training
Institute
(Location)Year wise no. of staff to be trained 2007-08 2008-09 2009-10 2010-11 2011-12
Training
HallsTraining
EquipmentsNo of
training
faculty
requiredRecurring
funds/year
(Rs. In
lakh)Non
recurrin
g funds
(Rs. In
lakh)Source:
- Table 19: Proposed Plan to Improve Agriculture & Allied Training Facilities for Farmers at taluk Level
Taluk New Agro
polyclinics
proposedGovt./
Non
Govt.Funds for overall
establishment
(Rs. In Lakh)Capacity
generated
(No. of farmers)Renovation of
Old Agro
Polyclinic (No.)Requirement of Funds for renovation of old / establishment of
new agro polyclinicsType of Facility
RequiredAdditional Capacity
generated through farmers
training (No. of farmers)Additional Capacity
generated through farmers
training (No. of farmers)Source:
- Table 20: Planning for Farmers Training Programme Related to Agriculture and Allied Departments (Funds requirement Rs.in lakh)
Sr. No. Name of Taluk Name of technology to be
transferredNo. of Training Institutes
available for training
programme
No of farmers to be trained and fund requirement Total 2007-08 2008-09 2009-10 2010-11 2011-12 Phy Fin Phy Fin Phy Fin Phy Fin Phy Fin Phy Fin Source:
- Table 21 : Service Centres in the District (Agriculture & Allied Sectors)
Name of Taluka No. of Service
CentresClassification Seed/ fertilizer
supplyIrrigation systems Farm equipments
and machineryAgriculture
consultancyDiagnostic
services providedSource:
- Table : 22 Basic Marketing Infrastructure for Agriculture Produce (Post Harvest Management) (Capacity in tonnes)
Sr. No. Taluka Storage Structures Markets (Numbers) Rural Godowns Cold storage Onion Storage Main market Sub market Nos. Capacity Nos. Capacity Nos. Capacity Source:
- Table 23 : Farm Level Storage Plan (Capacity in tonnes and investment Rs. In lakh)
Existing facilities (2006-07) Type No. Capacity Investment Rural Godowns Onion storage structures Zero energy chamber Others Source:
- Table 24: Area, Production and Yield of Major Crops in Irrigated/ Rain fed Conditions during Kharif Season
Crops Taluk Area (ha) Production (q) Irrigated % Rainfed % Total Irrigated % Rainfed % Total
Yield (q/ha) Irrigated% Rainfed Total Source:
- Table 25: Area, Production and Yield of Major Crops in Irrigated/Rain fed Conditions during Rabi Season
Crops Taluk Area (ha) Production (q) Irrigated % Rainfed % Total Irrigated % Rainfed % Total
Yield (q/ha) Irrigated% Rainfed Total Source:
- Table 26: Area, Production and Yield of Major Horticulture Crops
Crops Taluk Area (ha) Production (q) Irrigated % Rainfed % Total Irrigated % Rainfed % Total
Yield (q/ha) Irrigated% Rainfed Total Source:
- Table 27 : Taluk wise Yield Gap Analysis
Name of crops
/ CommodityAverage yield
(q/ha)Yield gap %
(with respect to FLD )Reasons for GAP in yield Taluk District State Frontline
DemonstrationSource:
- Table 28: Area, Production and Productivity Trend of Main Crops in the District (Area ? ha, Production ? q, productivity ? q/ha)
Sl. No. Name of Crop Normal 2004-05 to 2006-07 2007-08 (Projected) 2008-09
(Projected)Area
(A)Production
(P)Productivity
(Y)A P Y A P Y 1 2 3 4 5 6 7 8 9 10 11
2009-10 (Projected) 2010-11 (Projected) 2011-12 (Projected) A P Y A P Y A P Y 12 13 14 15 16 17 18 19 20 Source:
- Table 29: Planning of Agriculture Inputs in the District ? Seed
Sr. No. Name of the Crop Area under Crop (ha) Present SRR % 1 2 3 4 Source:
SRR – Seed Replacement Rate
- Table 30: Crop wise NPK Consumption (Year 2006 ? 07)
Sr. No. Taluk Major crops N P K Total 1 2 3 4 5 6 7 Total Source:
- Table 31: Planning of Fertiliser Requirement
Sr.No. Taluka Fertiliser Grade Use of fertiliser
(tonnes) During
2006-072007-08 2008-09 2009-10 2010-11 2011-12 Urea DAP MOP SSP Total complexes Total mixtures Grand Total
- Table 32 : Planning of Plant Protection Chemicals requirements
Sr. No. Taluka/Block Pesticides used Used in 2006-07 Requirement 2007-08 2008-09 2009-10 2010-11 2011-12
-
Table 33 : Availability of Improved Farm Equipments and Machineries
Name of
Improved
Farm
Implement /
Equipment /
MachineryTaluka-1 Taluka-2 Taluka-3 Taluka-4 Nos. Farmers Nos. Farmers Nos. Farmers Nos. Farmers Tractors Harvester Thresher
Taluka-5 Taluka-6 Nos. Farmers Nos. Farmers
Total Improved Farm Implement / Equipment / Machinery available in District Nos. No. of
FarmersSource:
- Table 34: Farm Machinery Status and Projection
Sr. No. Taluk Name of Improved farm implements
and farm machineriesPresent Status (Nos)
Source:
- Table 35: Protective (Community Tanks) Irrigation Plan - (Area in ha and Investment in lakh Rs.)
Type Existing Community Tanks (2006-07) 2007-08 2008-09 2009-10 2010-11 2011-12 No. Area Investment Source:
- Table 36: Perspective Micro Irrigation Plan (Phy. In ha and Fin. In lakh Rs.)
Crops Actual coverage
up to March 2006
(ha)Area coverage in
2006 – 2007
(ha)2007-08 2008-09 2009-10 2010-11 2011-12
- Table 37: Details of Credit Institutions in the District
Sr. No. Name of Taluka No. of institutions Total Commercial Banks RRBs Cooperative PACS Others
- Table 38: Crop Loan disbursement in District (short term credit) (Rs. In lakh)
Taluk Loan disbursed in 2006-07 Coop. Banks Commercial Banks RRBs No. of loans Amount No. of loans Amount No. of loans Amount 1 2 3
- Table 39 : Loan Disbursement for investment credit during XI Five Year Plan (Rs. In lakhs)
Sr.
No.Taluk Loan disbursed
during 2006-07Loan disbursement target 2007-08 2008-09 2009-10 2010-11 2011-12
- Table 40 : Agriculture Insurance Status (Phy.- ha area)
Name of Taluk Actual coverage of farmers upto 2006-07 Area coverage (ha) in 2006 ? 2007 Source:
- Table 41 : Planning of Soil Survey Programme (Year 2007 -08 to 2011 ? 12)
Name of the Taluk Watershed
NoGeographical area of
WatershedArea surveyed Since
beginning to Mar 2007Area to be deleted from
survey areaArea to be surveyed in year
2007-08 to 2011-12No of
VillagesArea (Ha) No of
VillagesArea (Ha) No of
VillagesArea (Ha) No of
VillagesArea (Ha)
- Table 42 : Area Available for Watershed Development and Plan
Name
of the
TalukaGeographical
Area (ha)Area not
Suitable
for
watershe
d
(ha)Area
available
for w/w
developm
ent
(ha)Area
treated so
far
(ha)Balance
Area
(ha)2007-08 2008-09 2009-10 2010-11 2011-12 Source:
- Table 43: Technologies for Insitu Moisture Conservation Plan
Name of Activity Total area covered (ha)
up to 2006-072007-08 2008-09 2009-10 2010-11 2011-12 Contour Cultivation Dead Furrows Ridges & Farrows Other
- Table 44 : Planning of Soil Testing Programme ( Year 2007 -08 to 2011 ? 12)
Item No of
VillagesTotal Samples
to be analyzedTotal Soil Health Cards to be
distributedRemarks General Soil sample Special Soil sample Micro Nutrient Soil sample Soil Survey sample Water sample Tissue (leaf & Petiole) sample Total
- Table 45: Proposed production of organic input and formation of organic groups in the next five years
Taluk Production of Organic inputs (q) Biofertilizers Vermi
CompostBiodynamic
CompostBiopesticid
es GroupBotanical
pesticidesOrganic
farming seeds
Other activities O. F.
GroupsOrganic
Certification
GroupDistrict Level
Activities
(Number)Required
Amount
(in lakh Rs.)
- Table : 46 : IPM Demonstrations in Next Five Years
(Phy – Area covered in ha)
(Fin – Rs. In lakh)Name of
cropAverage
Area/demonstration (ha)Present Area
under IPM (ha)IPM Demonstrations
In 2006-07No. of
Demos
conductedArea
covered
(ha)
IPM Demonstration Projections 2007-08 2009-10 2010-11 2011-12 2011-12 Phy. Fin. Phy. Fin. Phy. Fin. Phy. Fin. Phy. Fin. Source:
- Table : 47 : INM Demonstrations in Next Five Years
(Phy – Area covered in ha)
(Fin – Rs. In lakh)Name of
cropAverage
Area/demonstration (ha)Present Area
under IPM (ha)IPM Demonstrations
In 2006-07No. of
Demos
conductedArea
covered
(ha)
INM Demonstrations Projection 2007-08 2009-10 2010-11 2011-12 2011-12 Phy. Fin. Phy. Fin. Phy. Fin. Phy. Fin. Phy. Fin. Source:
- Table 48 : Varietal Demonstration in Next Five Year
(Phy – Area covered in ha)
(Fin – Rs. In lakh)Name of
cropAverage
Area/demonstration (ha)Present Area
under IPM (ha)Varietal Demonstrations In 2006-07 No. of
Demos
conductedArea
covered
(ha)
Varietal Demonstration Projection 2007-08 2009-10 2010-11 2011-12 2011-12 Phy. Fin. Phy. Fin. Phy. Fin. Phy. Fin. Phy. Fin. Source:
- Table 49 : Farmers Field Schools Projection in Next Five Year
Name of
cropTOF Trained
Available
Man power
(Nos.)FFS Conducted in last five year
(Aided)Yield
obtained
under
FFS In
06-07
q/haNormal
average
yield
obtained
in 06-07
q/haNo, of FFs
conductedNo. of
villages
CoveredArea
Covered
(ha)
2007-08 2009-10 2010-11 2011-12 2011-12 No. of
FFSNo .of
villages
to be
coveredNo. of
FFSNo. of
villages
to be
coveredNo. of
FFSNo. of
villages
to be
coveredNo. of
FFSNo. of
villages
to be
coveredNo. of
FFSNo. of
villages
to be
coveredSource:
- Table 50 : Tools Utilized for Improving Crop Production
Name
of CropArea under
Crop
(ha)Type of
Crop
Production
toolsArea under
Crop
Production
tools (ha)Proposed Area under Crop production tools (ha) 2007-08 2008-09 2009-10 2010-11 2011-12
Name of the
Persistence
technologyReason of
shortfalls of
technologyRemedies
suggested for
adoption of
technologyRemarks Source:
- Table 51: Crop Diversification Plan in Next Five Years
Existing Cropping
Pattern 2006-07Crop Diversification Proposed (Area in ha.) 2007-08 2008-09 Crop Group Area Area
under
cropChange in
area with
reference to
06-07 (+/-)Area
under
cropChange in
area with
reference to
06-07 (+/-)
Crop Diversification Proposed (Area in ha.) 2009-10 2010-11 2011-12 Area
under
cropChange in
area with
reference to
06-07 (+/-)Area
under
cropChange in
area with
reference to
06-07 (+/-)Area
under
cropChange in
area with
reference to
06-07 (+/-)
Source:
- Table 52 : Additional area to be brought / under Organic Farming in Next Five Years
Taluk Present area under Organic
Farming (ha) 2006-07Year wise area to be brought under organic farming (ha) 2007-08 2008-09 2011-12 2010-11 2011-12 Total Source:
- Table 53: Area Expansion Plan of Horticultural Crops. ( Area in ha)
Existing Cropping Pattern (2006-07) 2007-08 2008-09 2009-10 2010-11 2011-12 Crops Area Area Area Area Area Area Source:
- Table 54: Rejuvenation Plan of Horticultural Crops
Area brought under Rejuvenation (2006-07) 2007-08 2008-09 2009-10 2010-11 2011-12 Crops Area Area Area Area Area Area Source:
- Table 55: Sericulture Information
Sl.
No.Taluk No. of units Area under Mulberry
(ha)Average Cocoon Production
(kg/ha)GAP in yield (kg/ha) Reasons for GAP
in yieldDistrict State FLDs District
levelState
levelSource:
- Table 56 : Proposed Physical and Financial Targets for Sericulture for Plan (Rs. In lakh)
Name of
ActivityUnit cost
(Rs)2007-08 2008-09 2009-10 2010- 11 2011-12 Total Phy. Fin Phy. Fin Phy. Fin Phy. Fin Phy. Fin Phy. Fin Source:
- Table 57 (b): Distribution of land and livestock/poultry holdings in the District):
Items Year Landless
(0 ha)Marginal
(< 1ha)Small
(1-2 ha)Medium
(2-4 ha)Large
(> 4 ha)Poutry
- Table 57 (C): Average size of land and livestock/poultry holdings by farm size (Number of Poultry per 100 households)
Year Landless
(0 ha)Marginal
(< 1ha)Small
(1-2 ha)Medium
(2-4 ha)Large
(> 4 ha)All Poutry
- Table 57 (d): Benefits from Family Poultry
Indicators Farm Categories Landless
(0 ha)Marginal
(< 1ha)Small
(1-2 ha)Medium
(2-4 ha)Large
(> 4 ha)Average 1) Number of Chickens 2) No. of Ducks/ Other Species 3) Yearly income from chicken compared to other livestock species (% Rs./farm or holding/year 4). Yearly income from ducks compared to other livestock species (% Rs./farm or holding/year 5) Eggs production from poultry (No/farm family/year) Gender participation
i) Male
ii) FemaleSocial Profile
i) SC
ii) ST
iii) Others
- Table 58: Taluka wise Existing of Veterinary Institutions
VH-Veterinary Hospital, VD-Veterinary Dispensary, MVC – Mobile Veterinary Centres, PVC – Proposed Veterinary Centres, AID – AI Centres, PEC –Taluk GPs Institutions Taluk GPs (Nos) No. of Grampahchayat without any
veterinary institutionsVH VD MVC PVC AIC KVS sub
centreDiagnostic
LabsPEC Total
Source:
- Table 59: Production Plan of Livestock during the Next Five Years
Sr. No. Name of
commodityBaseline (2006-07) 2007-08 Nos Production Productivity Nos Production Productivity
2008-09 2009-10 Nos Production Productivity Nos Production Productivity
2010-11 2011-12 Nos Production Productivity Nos Production Productivity
Source:
- Table 60: Proposed Physical and Financial Programmes of Animal Husbandry Department Phy ? Number Rs. In lakh
Name of Activity Unit cost
(Rs)2007-08 2008-09 2009-10 Phy. Fin Phy. Fin Phy. Fin
Note: Activities must include dairy, Fisheries, Other Animal Products, Processing Sector2010-11 2011-12 Total Phy. Fin Phy. Fin Phy. Fin
- Table 61 : Fisheries Information
Year Taluka Details of Fisheries Units Marine – Traditional Non-Mechanised Boats Nos Average
Catch per year (tons)Expected Average Catch per year (tons) Gap/ Excess Catch (tons) Reason for gap/ excess catch
Details of Fisheries Units Marine – Mechanised Boats Nos Average
Catch per year (tons)Expected Average Catch per year (tons) Gap/ Excess Catch (tons) Reason for gap/ excess catch
- Table 62: Source wise Water Spread Area (WSA) in the District
Taluk Grama Panchayat Tanks Department Tanks Reservoirs Rivers < 40 ha < 40 ha No W.S.A (ha) No W.S.A (ha) No W.S.A (ha) No km 1 2 Total Source:
- Table 63 : Projections for Fish Production, Seed to be Stocked and Hatchery Requirement for Plan
a) Fish Production ( in Tonnes)l Year Production at different yields from different areas @2000kg/hect for 500hect @500kg/hect for 2000hect @100kg/hectare
6000 hectareTotal Present 2007-08 2011-12 b) Seed to be stocked advance fingerlings 50 mm size in lakhs Present 2007-08 2011-12 Table H. Hatchery required (Assumption 0.6 ha of hatchery can produce 20 lakh fingerlings and 40 lakh fingerlings required per ha) Present 2007-08 2011-12 Source:
- Table 64: Financial Targets and Achievements during X Plan for Fisheries Development in the District
Schemes 2002-03 2003-04 2004-05 Target Achievement Target Achievement Target Achievement 1 2 3
2005-06 2006-07 Target Achievement Target Achievement Source:
- Table 65: Projected Outlay for Fisheries Development during Plan (Rs.in lakh)
A) Budget required in the existing schemes Sl.No Name of the
SchemesYear Total 2007-08 2008-09 2009-10 2010-11 2011-12 1 2 Total
- Table 66 : Agro Processing Unit in the District (including Sugar, Milk, Silk, etc., related to Agriculture only)
Type of Agro-Processing unit Taluka No. of Processing units Per day capacity of Agro- Processing unit
(tonnes)Produce Processed by Agro- Processing unit during 2006-07 (tonnes) Total Source:
- Table 67: Marketing Infrastructure Plan Investment Rs.in Lakh)
Item Existing marketing facilities (2006-07) Investment Main Sub Source:
- Table 68: Action Plan for Social Forestry for Plan (Rs. In lakh)
Activity Year 2006-07 Year wise Targets 2007-08 2008-09 2009-10 Phy. Fin Phy. Fin Phy. Fin Total
2010-11 2011-12 Phy. Fin Phy. Fin
- Table 69: Product wise no. of SSI Units in the District
Category of Industry Nos. Investment (Rs. In lakh) Employment Total Source:
- Table 70: Action Plans for K.V.I Programmes during Plan (Rs. In lakh)
Programmes Unit cost (Rs) No. of Beneficiary Units Target 2007-08 2008-09 2009-10
Target 2010-11 2011-12
- Table 71 : Progress during X Plan under District Industrial Centre
Programme 2002-03 2003-04 2004-05 Target Achievement Target Achievement Target Achievement 1 2 3
2005-06 2006-07 Target Achievement Target Achievement
- Table 72: Action Plan of DIC for Plan (Rs.in lakh)
Programme 2002-03 2003-04 2004-05 Target Achievement Target Achievement Target Achievement 1 2 3
2005-06 2006-07 Target Achievement Target Achievement
- Table 73: Financial Achievements during X Plan and Projection for XI Plan for Development of Handlooms and Textiles (Rs. In lakh)
Scheme 2002-03 2003-04 2004-06 2005-06 2006-07
- Table 74: Details of the Proposed Industries Under Handlooms and Textiles (Rs. In lakh)
Programme 2002-03 2003-04 2004-05 Target Achievement Target Achievement Target Achievement 1 2 3
2005-06 2006-07 Target Achievement Target Achievement
- Table 75. Group Organizations in the District
Sr. No. Taluk Farmers Clubs Krishi Vigyan Mandals Commodity groups
/FIG/FosNos. Members Nos. Members Nos. Members
Self Help Groups
(SHGs)No. of villages
coveredNos. Members Nos. Members Source:
- Table 76: Financial Targets and Achievements during X Plan Period in the District Under District Sector Schemes
Sl.No. Name of the
SchemeHead of Account Amount Rs. In lakh 2002-03 2003-04 2004-05 Target Achmt Target Achmt Target Achmt
Amount Rs. In lakh 2005-06 2006-07 Target Achmt Target Achmt Source:
- Table 77: Financial Targets and Achievements during X Plan period of the District Under State Sector Schemes
Sl.No. Name of the
SchemeHead of Account Amount Rs. In lakh 2002-03 2003-04 2004-05 Target Achmt Target Achmt Target Achmt
Amount Rs. In lakh 2005-06 2006-07 Target Achmt Target Achmt Source:
- Table 78: Physical and Financial Programme Proposed under CDAP during XI Plan (Rs. In lakh)
Note: Please indicate the location of the Investments planned in this tableName of Work Unit cost (Rs) 2007-08 2008-09 2009-10 2010-11 2011-12 Total Phy. Fin. Phy. Fin. Phy. Fin. Phy. Fin. Phy. Fin. Phy. Fin. Agriculture
1
2
3
TotalHorticulture works in
farmers land
1
2
3
TotalAnimal Husbandry
1
2
3
TotalSocial Forestry
1
2
3
TotalFishery
1
2
3
TotalSericulture
1
2
3
TotalOthers
1
2
3
TotalG.Total